Teacher Support Materials
To Eat or Not to Eat? Instructional Guide
CENTRAL QUESTION: How do predators make decisions about prey?
TIME: 85-120 MINUTES
Overview:
- PART 1: Be the predator! (20-30 minutes)
How will you find food? Is that prey delicious or disastrous? - PART 2: How to fool a predator. (45-60 minutes)
Analyze which physical features influence predator behaviors. - PART 3: Predicting the Future. (20-30 minutes)
Will rapid changes affect predator-prey interactions?
MATERIALS:
- One computer per student or pair of students
- One computer with the ability to broadcast material onto a screen visible to the entire class
- Whiteboard or other surface for the teacher to use while facilitating class discussions
- Additional resources:.
- Teacher Data Interpretation Guide
- Student Data Interpretation Guide
- Specimen Measurement Guide
STANDARDS ALIGNMENT:
NGSS- LS2-2: Construct an explanation that predicts patterns of interactions among organisms across multiple ecosystems.
- Standard 6.4.2: Construct an explanation that predicts patterns of interactions among organisms across multiple ecosystems. Emphasize consistent interactions in different environments, such as competition, predation, and mutualism.
- Speaking & Listening Standard 1: Engage effectively in a range of collaborative discussions (one-on-one, in groups, and teacher-led) with diverse partners on grade 6 topics, texts, and issues, building on others’ ideas and expressing their own clearly.
- Language Standard 6: Acquire and use accurately grade-appropriate general academic and domain-specific words and phrases; gather vocabulary knowledge when considering a word or phrase important to comprehension or expression.
GETTING STARTED
Before class...
- Check permissions on students’ devices to ensure they can visit researchquest.org and that they are able to download pdfs from that website.
- Login at www.researchquest.org using the email address and password you used to create your Research Quest account.
- Click “My Account” to access your unique student access code to share with your class.
- Note: Be sure to use the student URL <www.researchquest.org/student> and access code for classes. This allows you to keep your administrative account free of student activity. Students should not create their own Research Quest account.
- Click “My Account” to access your unique student access code to share with your class.
- Review this lesson plan, making notes on standards and/or skills you would like to focus on with your students.
- Review the following recommended strategies for optimizing student learning outcomes.
- During or after the investigation, you likely will want to pause for whole-class discussion to provide practice sharing and responding to peer ideas.
- Build a shared vocabulary for the learning tasks. Identify target vocabulary words from the vocabulary included in this guide and descriptions of student activities. Encourage students to use these words often. Model correct usage if needed.
- Think about places where you can activate prior knowledge by prompting students to relate new concepts to a familiar context.
- Think about how to integrate this EPIC investigation with other curriculum-aligned activities.
- Create and engage student interest in the program by expressing your enthusiasm and/or describing your personal interest in studying museum specimens and learning more about mammalogy, entomology and ecology. You may also want to emphasize that students will be working with authentic materials on research questions that scientists address in their own work. The scientist guide in this investigation is a real scientist studying museum specimens – not an actor!
- Introduce students to sentence stems that reinforce flexible thinking and help students verbalize their thought processes:
- “I see...”
- “I think...”
- “I wonder...”
- Provide a brief overview of the lesson to the class.
- Introduce the objectives the class will be focusing on today.
- Teacher Login at: www.researchquest.org using the email address and password you used to create your Research Quest account. Then, navigate to the Investigations tab.
- Students Login at: www.researchquest.org/student using the Student Access Code unique to your account.
- Locate and launch this investigation (“How do predators make decisions about prey?”)
- Once logged in, students will be on the landing page for this investigation.
- Student Login URL: https://researchquest.org/student/
- Student Access Code: [locate on your My Account page]
Part 1: Be the Predator!
How will you find food? Is that prey delicious or disastrous?
(20 - 30 minutes)
OVERVIEW:
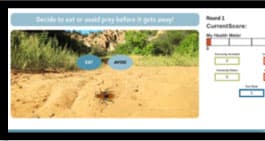
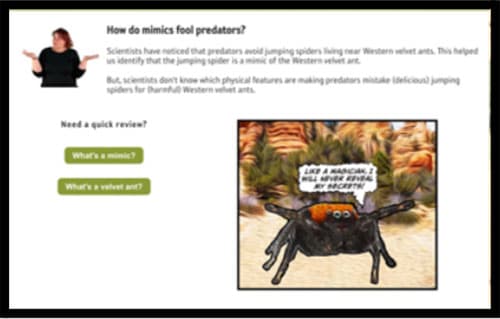
In this educational game, each student is a young, hungry lizard trying to survive! How do they figure out what to eat? Trial and error! Students see images of potential prey on their screen and must decide (quickly) whether to eat or avoid it. Some prey are a delicious meal and will help students increase their health score. But harmful prey will sting them and lower their health score. There are three rounds of game play. After round 1 and 2, educational comics teach students about the harmful prey they are seeing and how some prey (mimics) might try to fool them!
BIG IDEAS TO SUPPORT:
- Some insects are good food options and some are not. Predators learn by experience.
- Physical features of prey help drive predator-prey interactions.
- After a bad experience with harmful prey, predators avoid similar prey.
- Natural selection leads to mimics that fool predators into avoiding them by having similar features as harmful prey. This gives them a survival advantage over other edible prey.
ASSESSMENT:
In this section, the instructor may find it useful to focus on the following critical thinking skills, defined in more detail in the Student Learning Assessment Tool located under the “Teacher Support” tab of the website:
- Observations: Encourage students to share observations about the physical features of the insects and arthropods they are using to make decisions in the “Be the Predator” game.
- Interpretations: Ask students to infer which physical characteristics of the insects or arthropods are the most helpful predator cues. Which physical features are most useful for making good decisions about prey? How reliable are these chosen cues?
- Comparisons: Students should compare and contrast physical features across edible and inedible insects and arthropods. Ask students to use these comparisons to articulate a hypothesis about what physical features cue predators to avoid potential prey.
- Flexible thinking: Students may use their own game experience to propose a single feature that is causing the lizard to avoid eating a given insect or arthropod. However, they should consider that predators may be using multiple cues. They also should be open to changing or adjusting their idea if they are presented with new evidence.
FACILITATING POST-ACTIVITY DISCUSSION:
- During gameplay, listen for physical features in students’ comments/suggestions (e.g., “You can’t eat fuzzy ones!”). Build on those ideas in the full-class discussion.
- Listen for student recognition that emerging strategies aren’t foolproof, especially when mimics enter the picture!
- Student 1: “Don’t eat the colorful ones!” OR “Don’t eat the fuzzy ones.”
- Student 2: “Well, some of the colorful ones are good to eat in round 3!” OR “Some of the fuzzy ones are okay but most aren’t.”
- Discuss how reliable physical features are as cues for predators. Do they always work?
- Discuss how mimics gain a survival advantage by sharing features with harmful species.
- Talk about how such an advantage relies upon predators encountering harmful prey.
Learn-By-Doing
1. PLAY
WHAT STUDENTS ARE DOING
Students get three rounds of gameplay. Students will:
1. Choose to eat or avoid the prey they see.
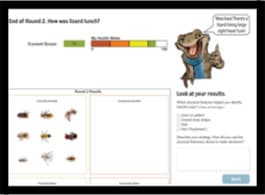
2. Use game results to answer reflection questions.
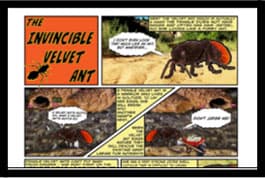
3. Read educational comics between game rounds to learn more about harmful prey and mimics.
TIPS FOR TEACHERS
Providing support: Prompt careful attention to physical features of prey that are correctly avoided and incorrectly eaten. These are harmful prey. What physical features do they have in common?
Don’t be afraid of productive struggle! The game is designed to require learn-by-doing and iterative strategy refinement. Lizards likely will die a few times as students test ideas about which physical features are most important.
Is someone stuck? Encourage other students to help anyone who is stuck in a game round. Listen to the strategies they discuss as fodder for post-activity discussion!
Vocabulary to support: cue, predator, prey, physical features, harmful, strategy, edible, mimic
Learn-by-Doing: Do not instruct students on harmful prey or mimics before playing. Let them dive right in and discover these ideas via experiential learning!
The comics will provide scaffolded instruction and reinforce reflection between rounds of interactive play.
This is the end of Part 1. Students may finish for the day or proceed to Part 2.
Part 2: How to Fool a Predator
Analyze which physical features influence predator behaviors
(45 - 60 minutes)
OVERVIEW:
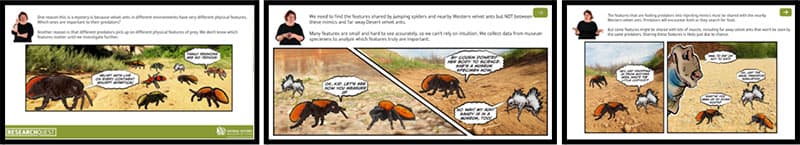
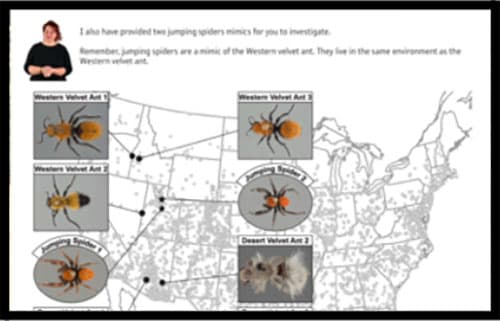
Students gather, analyze, and interpret data about the physical features of Western and Desert velvet ants (harmful species) and jumping spiders (successful mimics of Western velvet ants). After initial instruction from the mentor scientist, students can investigate two physical features that might be giving mimics a survival advantage: size (via measurement of specimens’ abdomen width and length) or color/pattern/shape (by rating similarity of specimen pairs). After collecting their data, students analyze their data patterns and explain what the data means. When they are done, students should be able to explain whether or not predators are using the physical feature(s) they studied as a cue to avoid the mimics (jumping spiders) in addition to the surrounding harmful species (Western velvet ants).
BIG IDEAS TO SUPPORT:
- Museum specimens allow us to investigate the physical features of different species sampled from real-world ecosystems. (Bonus: museum specimens won’t sting you or scurry away!)
- Careful, accurate collection of data from multiple specimens gives us confidence in our analysis.
- Patterns of data from multiple specimens are more reliable than single samples.
- If data patterns do not fit our current thinking, we need to revise our ideas.
- When data patterns show no differences, it can help us rule out ideas.
- Mimicry is a type of interaction between organisms.
- Physical features of harmful species and mimics influence predator-prey relationships by causing predators to avoid potential prey.
- Mimics gain a survival advantage if their physical features cue predators (erroneously) to avoid eating them.
- Because predators need to encounter harmful prey to learn to avoid them (and their mimics), the physical features that cue predators must be shared by mimics and harmful species that live in the same area. Features shared with far away harmful species will not be useful to local predators (and mimics).
ASSESSMENT:
In this section, the instructor may find it useful to focus on the following critical thinking skills, defined in more detail in the Student Learning Assessment Tool located under the “Teacher Support” tab of the website:
- Observations: When students measure specimens, encourage observations related to size. How big are these specimens? When students rate the similarity of color, pattern, and shape across pairs of specimens, encourage them to articulate specific observations about color (“They both have a dark orange color.”), pattern (“It’s orange, black, then orange.”), and shape (“Two rounded sections with a skinny middle.”) rather than relying on vague ideas (“They look the same.”).
- Interpretations: Students will make reasonable inferences and interpretations about the data they collect as they answer reflection questions designed to guide their analysis.
- Comparisons: Students will compare velvet ants and jumping spiders as they collect, analyze, and interpret data. Encourage students to identify what features are shared between jumping spider mimics and (nearby) Western velvet ants, but not (far away) Desert velvet ants.
Class Discussion
Activate students’ prior knowledge by asking what they know about mimicry. Use a quick review – deep understanding is not needed to get started. Quick definitions and examples:
- Mimicry occurs when the physical features of a species causes predators to (erroneously) avoid it.
- Camouflage is a type of mimicry. Leaf insects use camouflage to mimic the appearance of leaves and hide from insect predators.
- Other animals mimic harmful prey to cause predators to avoid them. For example, some harmless snakes mimic harmful coral snakes to avoid being eaten. Refer to Part 1 (“Be the Predator”), ask students about the velvet ant mimics they encountered in the game (round 3).
Introduction
1. Watch
WHAT STUDENTS ARE DOING
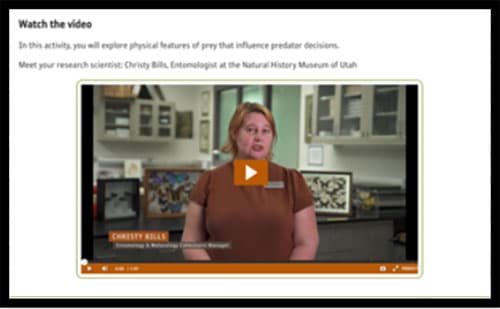
Watch a video about how the physical features of prey influence predator decisions.
(Video length: 1:07)
TIPS FOR TEACHERS
Strategies for support:
Before video:
Direct students to listen for the research question they will investigate and what data will provide evidence for that question.
After video: Check for understanding:
- Who is Christy Bills? What does she do?
- Christy is an entomologist at the Natural History Museum of Utah who takes care of hundreds of thousands of insect specimens to make sure they are available to people all over the world.
- What interesting phenomenon does Christy want you to investigate today?
- Mimicry
- What do you know about mimicry?
- What question did she ask about mimicry?
- Which characteristics of an organism are important to mimic?
- What evidence will help us answer this question?
- Observations and data from specimens.
2. Review
WHAT STUDENTS ARE DOING
OPTIONAL: Review educational comics about velvet ants and mimics.
TIPS FOR TEACHERS
Check for understanding:
It is not important that students remember all the details from the comics, but they should understand the big ideas:
- How do lizards determine what to eat?
- Some predators, like lizards, use physical features to determine what to eat and what to avoid.
- What are velvet ants? Are they harmful?
- Velvet ants are a type of wasp that is harmful and inedible to predators.
- What arthropod mimics velvet ants and what survival advantage does that give them?
- Some jumping spiders are mimics of velvet ants; they are edible prey even though they may appear like harmful velvet ants.
3. Background
WHAT STUDENTS ARE DOING
Read Christy’s instructions with accompanying comics.
TIPS FOR TEACHERS
These screens help students understand the logic behind the research (and upcoming data collection).
Check for understanding:
- Why can’t we use intuition to identify predator cues?
- Different velvet ants have very different features. It is hard to know which features predators are using to decide to avoid this harmful species.
- Studying the physical features that mimics share with nearby velvet ants tell us which features are actually cuing predators.
- Why do we care about far away velvet ants?
- Some physical features of mimics might be shared by lots of insects, including the velvet ants that live far away. Features that all (or most) insects have won’t be informative to predators.
- You want to find the specific feature that predators see that tells them to avoid local (Western) velvet ants and their jumping spider mimics.
- We might be tempted to visually identify features, but predators may see different features than we do! (You are not a lizard!) We need data to make a strong argument about which shared physical features are important to predators.
4. Observations
WHAT STUDENTS ARE DOING
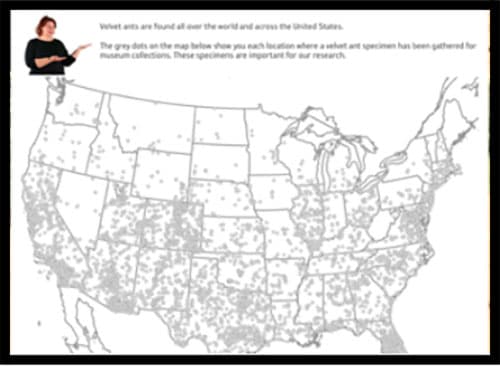
Make observations about where museums have collected velvet ant specimens.
TIPS FOR TEACHERS
Check for understanding:
Where are velvet ants found?
- Velvet ants are found all over the world and all over the United States.
- Note: Gaps in the maps mean that museums haven’t gathered a velvet ant in that location, not necessarily that they do not live there.
Additional information:
- Museum specimens refer to dead velvet ants that were collected and preserved in collections.
- The map doesn’t tell us how many velvet ants are out there, but it does show us that they live across the United States in many different types of conditions and ecosystems.
5. Compare
WHAT STUDENTS ARE DOING
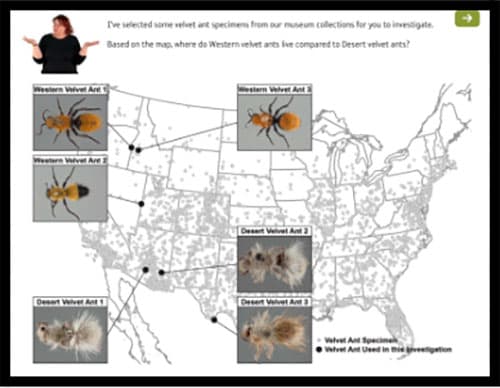
Compare where Western and Desert velvet ants live.
(Hint: In distinct geographic areas, far from each other.)
TIPS FOR TEACHERS
Check for understanding:
How would you describe where Western velvet ants live? Desert velvet ants?
Do they live in the same geographic areas?
- Velvet ants are found all over the world and all over the United States.
- Note: Gaps in the maps mean that museums haven’t gathered a velvet ant in that location, not necessarily that they do not live there.
6. Observe & Compare
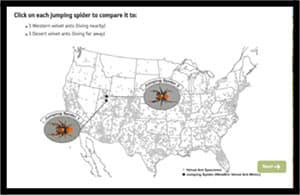
WHAT STUDENTS ARE DOING
Observe where jumping spiders live compared to velvet ants.
TIPS FOR TEACHERS
Check for understanding:
Which velvet ants live near the jumping spider mimics?
- The jumping spider specimens live in the same geographic area as the Western velvet ants.
- Jumping spider mimics do not live in the same geographic area as the desert velvet ants.
Key ideas to foster:
- Mimics survival rates increase when a predator gets stung by a local Western velvet ant and learns to avoid it.
- Students are looking for features shared between mimics (jumping spiders) and Western velvet ants that are NOT shared also with Desert velvet ants.
Investigate Features
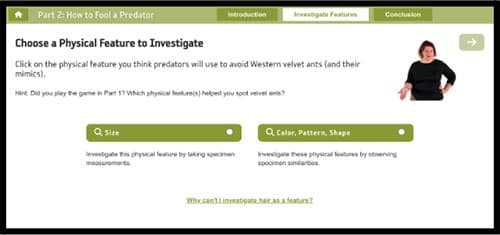
1. Choose
WHAT STUDENTS ARE DOING
Choose a physical feature to investigate:
- Size (make measurements)
- Color, pattern, shape (make ratings
TIPS FOR TEACHERS
Students select a feature to investigate, collecting data to determine if it is a valid predator cue:
- Size (making specimen measurements)
- Color, pattern, shape (making similarity ratings).
Strategies for support:
- You can allow students free-choice selection (choosing the feature they think is most likely).
- Or, you can assign features to groups of students so that there is variability in the class.
- Students (particularly early finishers) can complete both data gathering activities, but this is optional.
Size
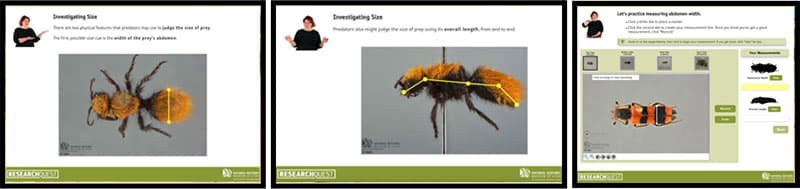
1. Measure
WHAT STUDENTS ARE DOING
Learn what to measure and practice it.
TIPS FOR TEACHERS
These screens teach students how to measure specimens.
There are:
- Two pages describing how to measure specimens.
- One practice round where students trace provided guidelines to learn accurate measurement techniques.
Troubleshooting:
- Help buttons in the measurement tool page provide tips for measuring overall length and abdominal width.
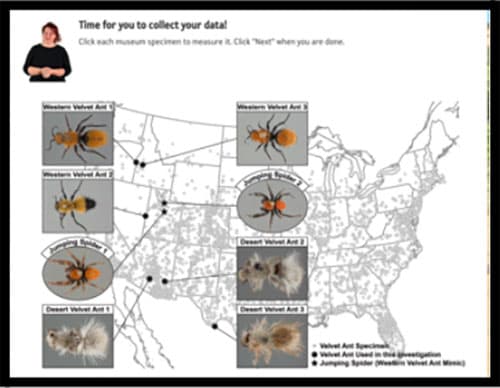
2. Collect
WHAT STUDENTS ARE DOING
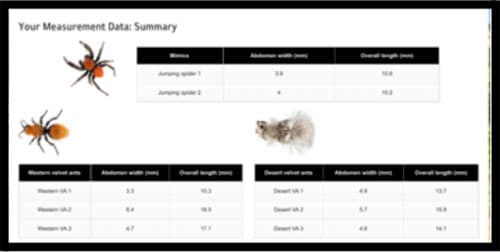
Collect measurement data for all eight specimens:
- Click on a specimen to measure abdomen width and overall length.
- Once all specimens have been measured (and marked done), click “Next” to analyze your data.
TIPS FOR TEACHERS
Students click on each specimen image to measure them. There are eight specimens to be measured:
- Two mimics (jumping spiders)
- Two Western velvet ants (live in same area as mimics)
- Two Desert velvet ants (live far away from mimics).
For each specimen, students make two (quick) measurements: abdomen width, overall length.
Troubleshooting:
- Students cannot move on without complete measurements of all eight specimens on this page.
- Abdomen width is best measured in the bottom (ventral) view.
- Overall length is best measured in the side (lateral) view.
- Use the measurement guide (PDF) to help prevent common errors and support accuracy.
3. Review
WHAT STUDENTS ARE DOING
Review collected data.
- Check for unusual values.
- Look for patterns.
TIPS FOR TEACHERS
The purpose of this step is for students to see the raw data they’ve gathered.
- Encourage them to think about how the numbers they see connect to the measurements they just made.
- This is a good time for students to spot check their data.
- (Are there any unusually small or large numbers? If so, do they remember one specimen being unusually small or large compared to the others? If not, could they have made a mistake during measurement?)
Students will move from this table to graphs of their data, giving them a chance to reflect on different ways of presenting data. You may want to ask students to look for patterns here (and then again when they view the graphs). How does size compare within a species? Across species?
Hint: You can help students reflect on the fact that patterns are harder to spot in tables than in graphs. Tables are best for detailed information. Graphs are best for identifying overall data patterns.
4. Reflect & Share
WHAT STUDENTS ARE DOING
Use the graph of your data to answer five reflection questions. Download your results to share with your peers and teacher.
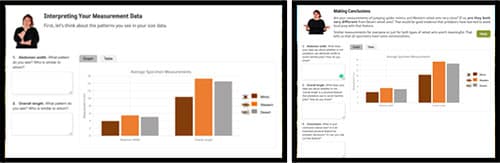
TIPS FOR TEACHERS
- Students first describe the data patterns that they see in the graphs (screen 1).
- They then interpret what those data patterns tell them about their results (screen 2).
Note: You can use the tabs to switch between the graph view and the table view to compare different formats of presenting data.
Strategies for support:
- “Help” buttons provide additional information about how to interpret the graphs.
- There are two provided data interpretation guides – one for teachers (INCLUDES TYPICAL ANSWERS) and one for students. You can help walk students through the provided examples and compare them to their own data patterns.
Transitions:
- After completing the analysis portion, students will be given the option to finish data gathering for the day or complete the alternate data collection. Fast finishers likely will have time for both data collection activities.
- If students already have completed both sections, they will be returned to the investigation landing page to finish for the day or move on to Part 3.
Color, Pattern, Shape
1. Practice
WHAT STUDENTS ARE DOING
Learn how to rate the similarity of specimen color, shape, and pattern.
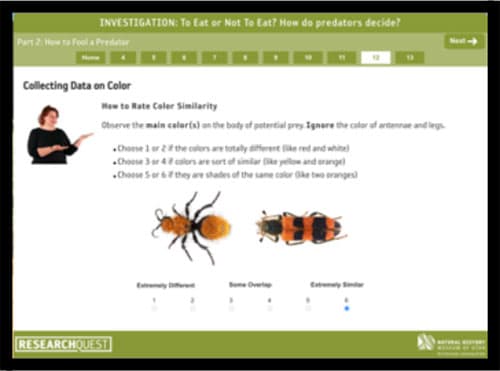
TIPS FOR TEACHERS
These screens teach students to use a 1-6 point scale to rate the similarity of specimen pairs on three features: color, shape, and pattern.
This practice section is structured as follows:
- Instructions on how to rate the comparison between two specimens.
- Practice rating round 1
- Compare expert response to student response
- Practice rating round 2
- Compare expert response to student response.
This sequence repeats three times, once per feature (color, pattern, shape).
2. Compare
WHAT STUDENTS ARE DOING
Select each mimic to compare to velvet ants (nearby Western velvet ants and far away Desert velvet ants). Follow these steps to collect rating data for all eight specimens:
1. Click on a specimen to pull up the comparison view.
2. Rate the similarity between the mimic and velvet ant on a scale from 1-6.
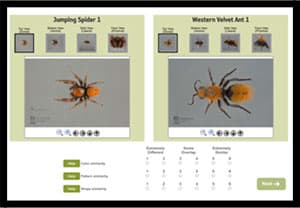
3. Complete 6 comparison rounds for each mimic (12 comparisons total) then click “next” to move on to analysis.
TIPS FOR TEACHERS
It may help to remind students of the reasoning behind the comparison activity. Potential question to ask:
- How will comparing the similarity of mimics with velvet ants that live in the same area vs. velvet ants far away help us answer our research question?
- Who should the mimics resemble? Why?
Students should be encouraged to use the ratings scale consistently. You may need to remind students that a pair of specimens may be similar on one feature (e.g., color), but not another (e.g., pattern).
- 1 – 2 = Extremely different
- 3 – 4 = Some overlap
- 5 – 6 = Extremely similar
Troubleshooting:
“Help” buttons provide additional instructions about how to rate the similarities between specimens and how to use the scale consistently.
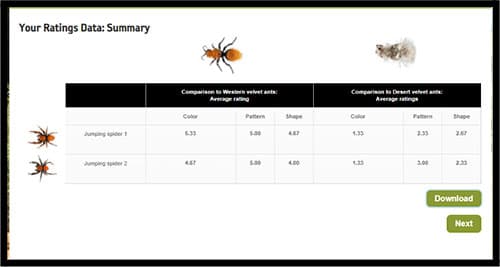
3. Review
WHAT STUDENTS ARE DOING
Review overall ratings data in a table.
TIPS FOR TEACHERS
The purpose of this step is for students to see the raw data they’ve gathered.
Encourage them to think about how the numbers they see connect to the ratings they just made. This is a good time for students to spot-check their data. (Are there any unusually small or large numbers? If so, do they remember particularly strong or weak similarities between the pairs in question?)
Students will move from this table to graphs of their data, allowing them to reflect on different ways of presenting data. You may want to ask students to look for patterns here (and then again when they view the graphs). How does size compare within a species? Across species?
Hint: You can help students reflect on the fact that patterns are harder to spot in tables than in graphs. Tables are best for detailed information. Graphs are best for identifying overall data patterns.
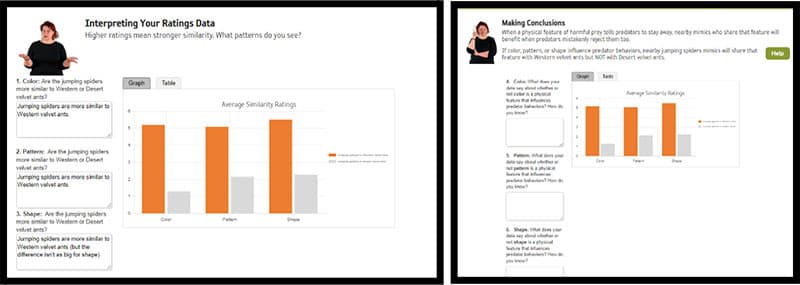
4. Analyze & Interpret
WHAT STUDENTS ARE DOING
Use the graph to answer questions that will guide you through analyzing and interpreting your data.
TIPS FOR TEACHERS
- Students first describe the data patterns that they see in the graphs (screen 1).
- They then interpret what those data patterns tell them about their results (screen 2).
Note: You can use the tabs to switch between the graph view and the table view to compare different formats of presenting data.
Strategies for support:
- “Help” buttons provide additional information about how to interpret the graphs.
- There are two provided data interpretation guides – one for teachers (INCLUDES TYPICAL ANSWERS) and one for students. You can help walk students through the provided examples and compare them to their own data patterns.
Transitions:
- After completing the analysis portion, students will be given the option to finish data gathering for the day or complete the alternate data collection. Fast finishers likely will have time for both data collection activities.
- If students already have completed both sections, they will be returned to the investigation landing page to finish for the day or move on to Part 3.
OPTIONAL CLASS DISCUSSION:
Leading a class discussion with students after they have completed data collection/analysis is helpful. Students should share and compare their results and discuss implications. Potential questions to ask:
- What did students who collected data about measurements find? Is size a cue for predators to avoid the jumping spider mimics?
- What did students who collected data about color, pattern, and shape find? Are any of those a cue for predators to avoid the jumping spider mimics?
- How did jumping spiders develop similar physical features to the nearby velvet ants?
- What does this tell us about how mimicry affects predator-prey relationships?
- Is there a relationship between the jumping spider and the velvet ant? (mimicry) Who benefits most from that relationship? (jumping spider)
It may be helpful to emphasize that mimics cannot purposefully look like harmful species. Random genetic variation can create some individuals who happen to share key features with harmful species (i.e., the features that cue predators). Their survival advantage lets them reproduce and pass on those advantageous traits. Over generations, this natural selection results in most individuals resembling the harmful species.
This is the end of Part 2. Students may finish for the day or proceed to Part 3.
PART 3: Predicting the Future!
Will rapid changes affect predator-prey interactions?
(20 - 30 minutes)
OVERVIEW:
Will rapid changes impacting ecosystems affect predator-prey interactions? This section builds on knowledge gained from data collection and analysis in Part 2. Mimics share important features (color, pattern, and to a lesser degree, shape) with harmful prey (nearby Western velvet ants). This gives them a survival advantage because these shared physical features can fool predators into not eating them even though they are perfectly delicious (unlike the harmful Western velvet ants). However, changes in the populations or features of Western velvet ants could impact the future survival advantages mimics like the jumping spider.
Big IDEAS:
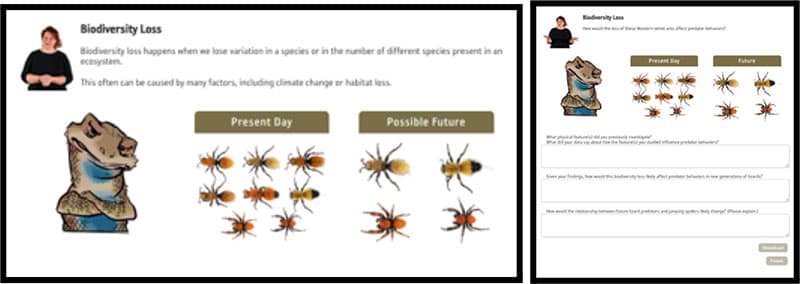
- Biodiversity loss happens when we lose variation in a species or in the number of different species present in an ecosystem. This can be caused by many factors, including climate change or habitat loss.
- Organisms inhabit geographic ranges. Range changes occur when a species dies off or moves to a different geographic range. This can happen based on changing availability of resources or abiotic changes (e.g., species move to a cooler location).
- Understanding what physical features predators use to determine whether to avoid certain prey can guide predictions about what will happen in the future if:
- The harmful species no longer share similar color/pattern with local mimics.
- The harmful species is no longer encountered in the same geographic range.
- In both of these cases, jumping spider mimics would lose some (or all) of their survival advantage over time.
ASSESSMENT:
In this section, the instructor may find it useful to focus on the following critical thinking skills, defined in more detail in the Student Learning Assessment Tool located under the “Teacher Support” tab of the website:
- Observations: Students will make observations about differences between a set of organisms in a “present day” ecosystem and a “future” ecosystem.
- Interpretations: Students will make inferences and interpretations about the implications of ecosystem changes based on their observations as well as the data they gathered in Part 2 of the investigation.
- It may help to remind students about the class conclusions from part 2. Which physical features do predators use as a cue to avoid Western velvet ants AND jumping spider mimics?
- Connections: Students will practice making connections between what they learned about predator behavior, the cues that predators use to avoid harmful species (and their mimics), and their own observations about the impact of biodiversity loss and range change in the scenarios.
Introduction
1. Explore
WHAT STUDENTS ARE DOING
Explore what happens to predators’ interactions when environments change. Choose either biodiversity loss or range change to reason about for this section.
TIPS FOR TEACHERS
Students will apply their knowledge about the cues that predators use to avoid harmful prey in one of two scenarios: Biodiversity Loss or Range Change.
After students make a selection, they will see images that provide a visual summary of the species that predators will encounter in the “present day” and in the “future.” The visual summary is meant to help students focus on what the scenario entails before they begin to make (guided) inferences and interpretations.
You may want to assign an equal number of students to each rapid change so they can discuss their inferences and interpretations with each other.
Strategies for support: Consider a quick think-pair-share activity or classroom discussion to discuss students’ predictions. Potential questions to ask:
- What happens when environments change?
- Will predators' interactions with their prey change as well?
- Will the relationship between the mimics and the harmful species (Western velvet ants) change?
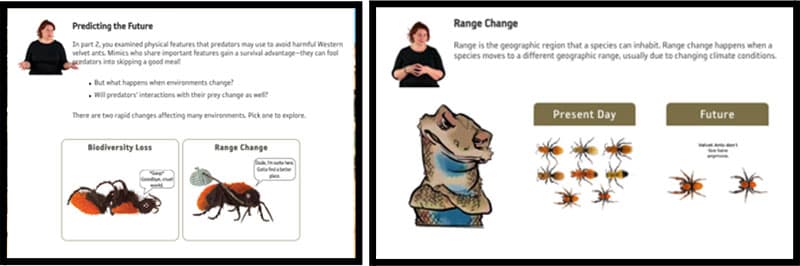
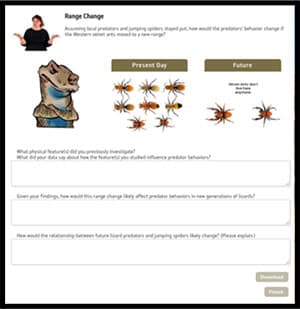
2. Reason: RAnge Change Option
 WHAT STUDENTS ARE DOING
Use the image and questions to reason about how a predator’s behavior might change if the Western velvet ants move to a new range.
TIPS FOR TEACHERS
The images provide a visual summary of the species that predators will encounter in the “present day” and in the “future.”
Direct students to use the images and findings from part 2 to reason about the range change scenario.
Vocab support: Your students may need help understanding what range change means. Ask questions to activate prior knowledge and spur new thinking:
- What does “range change” mean?
- Range change: Changes to an organism’s range mean changes to where it can live.
- What might cause an organism’s range to change?
- Anything that changes available resources or suitability of the habitat can lead to range change. This includes changes to temperature and precipitation, wildfire and other natural disturbances, and human-led changes like deforestation and urbanization.
Strategies for support: Students should reflect on the questions and provide thoughtful responses. You may find it helpful to guide students’ reasoning towards the answers listed below as you monitor their conversations. Alternatively, use these questions to help guide a final, full-class discussion.
- What physical features did you previously investigate?
- Possible answers:
- Size (via measurements of abdominal width and overall length)
- Color, pattern, shape (via similarity ratings)
- What did your data say about how the feature(s) you studied influence predator behaviors?
- Possible answers:
- Similarity ratings: They likely found that color, pattern, and shape all could be cues, but color and/or pattern were strongest cues.
- Measurements: They likely found that size was not a significant cue for predators to eat or avoid mimics (mimics were different from both velvet ants).
- Is [color, pattern, shape, or size] still shared between the mimics and the local velvet ants? Given your findings, what does this mean for predator behaviors in new generations of lizards?
- Possible answer:
- No. Nothing is shared because velvet ants don’t live here anymore. New generations of lizards would never encounter an orange velvet ant (or a velvet ant with the same pattern as the jumping spider), so they won’t learn to avoid prey with these cues.
- How would the relationship between future lizard predators and jumping spiders likely change?
- Possible answer:
- Future lizard predators would likely eat jumping spiders because they will not have any reason to try and avoid them.
Students can download and share their responses to reflection questions.
3. EXPLORE: BIODIVERSITY LOSS OPTION
WHAT STUDENTS ARE DOING
Use the image and questions to reason about what would happen if some varieties of velvet ants disappeared from an ecosystem.
TIPS FOR TEACHERS
The images provide a visual summary of the species that predators will encounter in the “present day” and in the “future.” Direct students to use the images and their research from part 2 to reason about the biodiversity loss scenario.
Vocab support: Your students may need help understanding what biodiversity is and why it is important. Ask questions to activate prior knowledge or spur new thinking about biodiversity.
- What does biodiversity loss mean?
- When we lose variation in a species or in the number of different species present in an ecosystem.
- Why does it matter?
- Ecologists usually look at biodiversity as a positive, healthy feature of ecosystems. A lack of biodiversity doesn’t mean the ecosystem isn’t healthy, but it could mean that it is more fragile or at risk of falling out of balance if a species disappears and there aren’t other species to fill its role.
Strategies for support: Students should reflect on the questions and provide thoughtful responses. You may find it helpful to guide students’ reasoning towards the answers listed below as you monitor their conversations. Alternatively, use these questions to help guide a final, full-class discussion.
- What physical features did you previously investigate?
- Possible answers:
- Size (via measurements of abdominal width and overall length)
- Color, pattern, shape (via similarity ratings)
- What did your data say about how the feature(s) you studied influence predator behaviors?
- Possible answers:
- Similarity ratings: They likely found that color, pattern, and shape all could be cues, but color and/or pattern were strongest cues.
- Measurements: They likely found that size was not a significant cue for predators to eat or avoid mimics (mimics were different from both velvet ants).
- Is [color, pattern, shape, or size] still shared between the mimics and the local velvet ants? Given your findings, what does this mean for predator behaviors in new generations of lizards?
- Possible answer:
- Color is no longer shared. Pattern is only shared with about half the velvet ants. Shape is still shared. Predators may not avoid the jumping spider mimics color and patterns were the strongest cues to avoid harmful species. Color is no longer shared and pattern is not as consistent. Thus, predators may not be as likely to avoid the jumping spider mimics.
- How would the relationship between future lizard predators and jumping spiders likely change?
- Possible answer:
- Future lizard predators would likely eat more jumping spiders because they would not have bad experiences with orange velvet ants to teach them to avoid prey that are that color. They may still avoid some based on pattern, but the avoidance may not be as reliable as when color and pattern both were shared.
Students can download and share their responses to reflection questions.
4. Review
 WHAT STUDENTS ARE DOING
Watch a final video to wrap up what you’ve learned in this investigation.
(Video length: 0:52)
TIPS FOR TEACHERS
Consider a class discussion based on this video to clarify big ideas students should be taking away from this investigation.
Before watching the video:
Direct students’ attention to the example of the bee and the moth Christy shows them in the video.
After watching the video:
Ask students these questions to facilitate a final discussion about how mimics are impacted by changes to the organisms they are mimicking:
- What features do the moth and bee from the video share?
- Similar colors, similar patterns of colors, both are winged (shape).
- What could they do to investigate this further?
- Compare the size of bees that share a range with the moth mimic and those that don’t share a range with the moth mimic. Size might be a cue if the moths and local bees are similar size, but far away bees are not.
- They could also compare the color, pattern, and shape similarity between bees that share a range with the moth mimic and those that don’t. If local moths and bees have similar color, pattern, or shape (but far away bees do not), predators might be using these features as cues.
- What might those shared features mean for the moth?
- Because the moth is a known mimic of the bee, we can assume that its similarities are protecting it against predators that might otherwise eat it.
- What might happen to the moth if something caused the bees to disappear from the ecosystem they share?
- A lack of bees in the ecosystem might mean that future predators would eat more of the mimic moths because they would have no way of learning that they should not eat things that look like bees.
This is the end of Part 3 and of the investigation. Check out one of our other Research Quest investigations on our website, https://researchquest.org.