Teacher Support Materials
Aspen Restoration Instructional Guide
CENTRAL QUESTION: How do we restore aspen forests?
OVERVIEW
TIME: 85-120 minutes
Part 1: SURVEY (20-30 minutes)
- Aspen Rapid Assessment Challenge! Is this a healthy aspen forest?
Part 2: COLLECT (60-80 minutes)
- What’s happening here? Does this plot need restoration treatment?
Part 3: CONNECT (20-30 minutes)
- What can we do? Does your site need restoration treatment?
Part 4: SHARE (10-15 minutes)
- What’s your recommendation?
MATERIALS:
- One device (laptop or Chromebook) for each research partnership.
- Printed or Google Doc Research Assistant Notebooks for students to record notes
- White board or other surface for teacher to use while facilitating class discussions
- Additional resources:
STANDARDS ALIGNMENT:
Utah SEEd Standard- Standard 6.4.4: Construct an argument supported by evidence that the stability of populations is affected by changes to an ecosystem. Emphasize how changes to living and nonliving components in an ecosystem affect populations in that ecosystem. Examples could include Utah ecosystems such as mountains, Great Salt Lake, wetlands, or deserts. (LS2.C) NGSS Correlation: MS-LS2-4
NGSS Science and Engineering Practices, Disciplinary Core Ideas, Crosscutting Concepts
- MS-LS2-4 Ecosystems: Construct an argument supported by empirical evidence that changes to physical or biological components of an ecosystem affect populations.
Common Core State Standards (CCSS): English/Language Arts Standards
- Writing Standard 1: Write arguments to support claims with clear reasons and relevant evidence.
- Writing Standard 7: Conduct short research projects to answer a question, drawing on several sources and refocusing the inquiry when appropriate.
- Language Standard 6: Acquire and use accurately grade-appropriate general academic and domain-specific words and phrases; gather vocabulary knowledge when considering a word or phrase important to comprehension or expression.
GETTING STARTED
This investigation provides support for teaching the content standards, along with the nature of science/how science is done, developing claims, working with evidence, and using reasoning skills. (Hint: Review the Student Learning Assessment Tool for opportunities to foster and assess learning with your students. They are linked from the Support tab of the Research Quest website.)
Before class:
- Navigate to www.researchquest.org and login using the email address and password you used to create your Research Quest account. Then, navigate to the investigations tab.
- Locate this investigation on that page - far right - and click on the orange button with the text that reads, “Student Login Information, ” located below the name and thumbnail for this investigation. The student URL and your unique student access code will appear on the screen.
- Review this lesson plan, making notes on standards and/or skills you would like to focus on with your students.
- Review the following recommended strategies for optimizing student learning outcomes.
- After working individually, bring students together to share ideas, compare findings, and reason about similarities/differences.
- Build a shared vocabulary for the learning tasks by identifying target vocabulary beforehand and encouraging students to use these words often. Model correct usage if needed. Lists with definitions can be found in the investigation under the toolkit icon on the top left.
- Think about places you can activate prior knowledge by prompting students to relate new concepts to a familiar context.
- Think about how to integrate the EPIC investigations with other curriculum-aligned activities.
- Create and engage student interest in the program by expressing your own enthusiasm and/or describing your personal interest in this investigation. You may, also, want to emphasize that students will be working with authentic materials and methods on research questions that scientists actually address in their work.
- Introduce students to sentence stems that reinforce flexible thinking and help students verbalize their thought processes:
- “I see... ”
- “I think... ”
- “I wonder... ”
In class:
- Provide a brief overview of the lesson to the class.
- Introduce the objectives the class will be focusing on today.
- Instruct students to navigate to the URL www.researchquest.org/student/ and enter your unique Student Access Code found on your My Account page. It is important you have students use this particular URL and your access code as this allows you to keep your administrative account free of student activity.
- Once logged in, students will be on the investigation landing page where they can click on this particular investigation.
Getting Started: Investigation Overview
How do we restore aspen forests?
Overview: Aspen forests are unique because they share a root system. It’s why Pando, an aspen forest, is considered one of the largest organisms on earth. FUN FACT: Pando is also considered one of the oldest living organisms on earth at an estimated 80,000 years old. Aspen trees are a keystone species that is home to a diverse range of birds, insects, and mammals not found outside of these forest areas. They are considered one of the most biodiverse forest ecosystems.
Because of the unique interconnected nature of aspen forests they need specific conditions for their populations to thrive. Although resilient, when climate changes and conifer trees encroach it can have a detrimental effect on aspen populations.
This investigation dives into the forest management process of rapid and detailed assessments of aspen forests, they will use their data to generate a restoration action plan where needed. Students will follow the same field guides as US Forestry Service land managers.
| Helpful tips to get started | |
Navigation |
 MAIN MENU: Jump to desired part of the investigation. MAIN MENU: Jump to desired part of the investigation. BACK: Go back to the previous screen. TOOLKIT: Vocabulary and other scaffolding to support student learning. |
| Investigation Introduction |  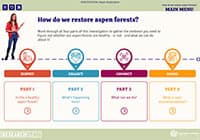 (5:31 min) |

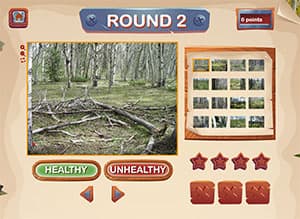
Part 1: SURVEY
OVERVIEW
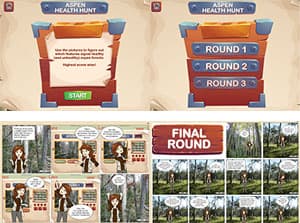
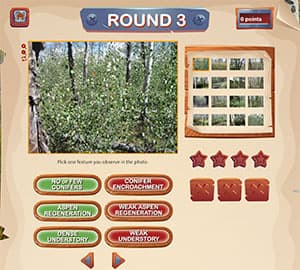
Students make rapid visual assessments of aspen forest images using the Aspen Health Hunt game. They will Identify key features of healthy and unhealthy aspen forests. As students classify images as “healthy” or “unhealthy” they receive feedback that helps them discover the specific features of healthy and unhealthy aspen forests. By Round 3 students will use what they have learned to select the specific features that match the aspen forest images.
| STUDENT ACTION | TIPS FOR TEACHERS | |
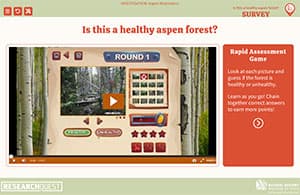 |
Watch the video at the beginning of this part of the investigation. (0:27 sec) |
Students start by watching a video of a NHMU scientist who will set the context for this activity. |
 |
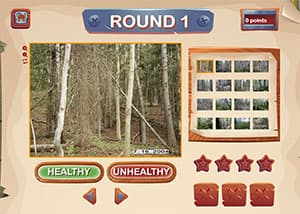
Start with ‘Round 1’ , use the buttons to classify each image as “healthy” or “unhealthy” . Be sure to review your feedback after each selection. Build your streaks but don’t strike out. Note the comic support in the toolkit. |
In the Aspen Health Hunt game, students make rapid assessments to score field photos as healthy or unhealthy aspen forests. These photos are from actual field work done by scientists who manage these forests. There are three rounds, structured as follows:
If students seem to struggle you may want to pause and complete a round together reviewing the feedback images as you go. (See the Teacher Game Answer Key which you can use as you support your students.) |
|
There are 3 rounds with each round progressively more difficult. By round 3 you will need to identify specific features of health in each image. |
Part 2: COLLECT
What’s happening here?
OVERVIEW
In this part, students learn more about factors that impact aspen populations. After selecting a site and plot to study, students will collect data using four key assessments of health. Analyzing their data about competition and new growth (aspen regeneration) students will determine if their aspen plot is healthy or not. By the end of this part, students will have evidence that can back up their claim as to what is unhealthy or not about their study site.
| STUDENT ACTION | TIPS FOR TEACHERS | |
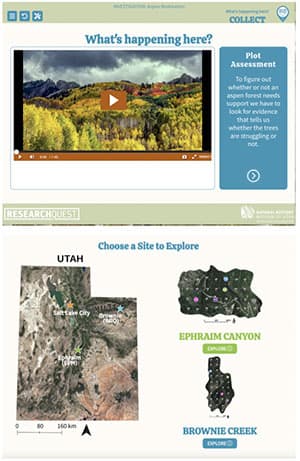 |
Watch the video that starts this part of the investigation. (1:43 min) Then, select a site and plot to study. Each of these plots were all once aspen dominated areas. |
Students will select a site and plot to study. Although there are 30 plots from each site we’ve narrowed their choices to 5 plots from each of two sites. Each of these plots were all once aspen dominated areas. You may choose to pair students to work on a plot together. You could have student pairs work on different plots so they can then share their plot data and gain a larger, collective picture of what is happening to aspen trees in their site. |
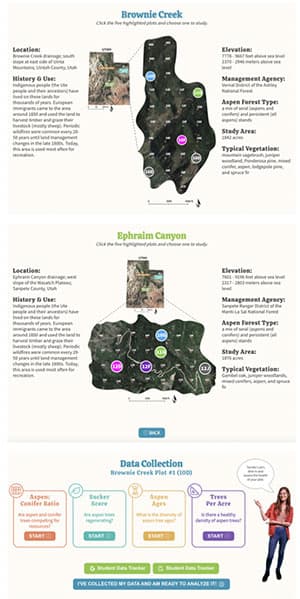 |
Once you’ve selected your plot it’s time to dive into data collection using four key assessments. Like land managers and scientists in the field you’ll need to make some detailed observations. You’ll use the same Aspen Restoration Assessment Guidelines as land managers and scientists in the field. |
Once students have selected a plot to study they will be directed to a data collection menu. Students will collect and analyze data from 4 data points:
Each of these data points will help students determine the health of the aspen population in their plot. |
| Aspen:Conifer Ratio Are aspen and conifers competing for resources? |
||
|---|---|---|
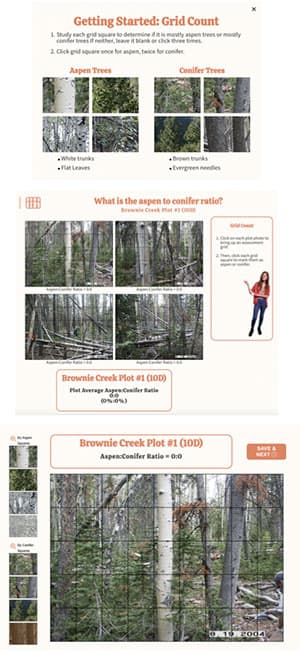 |
You’ll start with Aspen:Conifer Ratio. In this activity you’ll make detailed observations of 4 pictures from your plot. Click the grid squares to record your findings. White squares are aspen and brown squares are conifer. |
Students make detailed observations, just like scientists and land managers in the field of four plot images, taken from four directions. Each image is divided into grids to help guide students in determining the ratio of aspen to conifer trees. By clicking on the grid square students will be able to classify the square as an aspen (one click), conifer (two clicks), or neither (no clicks). The purpose of this will be to evaluate whether aspens are competing with conifers for resources. Once students have categorized all four images they will be given an aspen:conifer ratio average based on their observations. They will download this data and use it at the end of this part of the investigation. (See the Plot Images Master List which you can use as you support your students.) |
| Sucker Score Are aspen trees regenerating? |
||
|---|---|---|
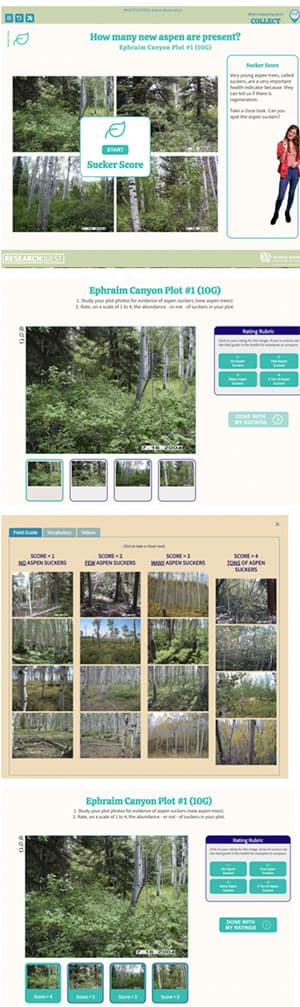 |
You’ll continue your observations looking for new aspen growth. These young aspen sprouts are called “suckers”. Once they get a bit bigger, they become “saplings” before maturing into adult aspen trees. Here you will compare your 4 plot pictures with a set of other pictures. Then, classify each image as:
This will help you know if your plot is regenerating (growing more aspen trees). Be sure to use the Field Guide found in your toolkit for additional support. |
Again, students will make detailed observations. Observations are a key way that land managers and scientists collect data in the field. Students will compare their four images with sample images from four categories of sucker health. Does their plot have no, few, many, or a ton of aspen suckers? This data is important to determine how well aspens are regenerating (new growth). Many factors, both biotic and abiotic, impact the growth of new aspen trees. At this point in the investigation students are focusing on whether or not there is new growth. In Part 3 they will look at factors that may be impacting new growth. The purpose of this assessment is to determine if regeneration is happening in their plot. Continual regeneration is an important factor for healthy aspen tree populations. Once students have categorized all four images they will be given a sucker score average based on their classification. They will download this data and use it at the end of this part of the investigation. |
| Aspen Tree Age Diversity What is the diversity of aspen tree ages? |
||
|---|---|---|
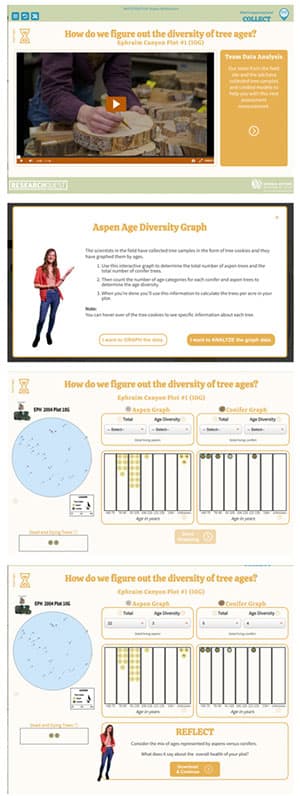 |
Watch the next video from Pippi. (1:16 min) She will explain that when data is collected in the field it needs to be studied and analyzed. One of the ways scientists visualize their data is with graphs and charts. You’ll be able to choose how you want to interact with the data collected from the field. Do you want to GRAPH and analyze the data yourself? Or do you want to ANALYZE the data our team of scientists has already graphed? This data will help you determine the aspen age diversity of your plot. You’ll look for how many different live aspen tree age groupings are found in your plot. Be sure to only count living trees! As a bonus you’ll also be able to compare the number of aspen trees with the number of conifer trees in your plot. |
After another video from Pippi to set context, students will analyze tree samples collected by scientists in the field and processed back in their labs. This processing includes tagging the samples with important data including the type and age of the tree. Students will sort and graph these tree cookies (tree ring samples) into aspen and conifer categories as well as age categories. This will help students determine the aspen tree age diversity, as well as serve as another check for comparing aspen and conifer trees in their plot. Having a diversity of tree ages is another important factor for the health of aspen tree populations. Healthy aspen forests have a range of aspen tree ages, including young suckers and saplings to ensure there are new trees to take the place of old ones as they die. Note: This activity focuses on the age diversity of large live aspen trees not graphing the age of suckers and saplings. Once students have either graphed and/or analyzed the tree cookies they will have age diversity data based on their classifications. Then they will download this data and use it at the end of this part of the investigation. (See the Tree Cookie Master List which you can use as you support your students.) |
| Trees Per Acre Is there a healthy density of aspen trees? |
||
|---|---|---|
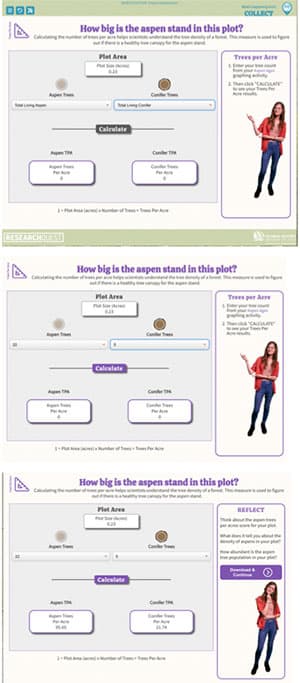 |
For your last assessment, take the number of aspen and conifer trees you found in the Aspen Ages activity and plug it into the Trees Per Acre Calculator to get your fourth data point. This will tell you how many trees per acre are found in your plot, which gives you the density of aspen and conifer trees for your plot. REFLECT What does it tell you about the density of aspens in your plot? How abundant is the aspen tree population in your plot? |
Using the data they collected in the age graphing activity students will calculate both aspen and conifer trees per acre to reveal the density of aspen trees in the plot. This is important data because it’s another way land managers and scientists determine the health of aspen populations. Once students have calculated this data they will download it for use at the end of this part of the investigation. |
| Plot Health Assessment Data Data Summary |
||
|---|---|---|
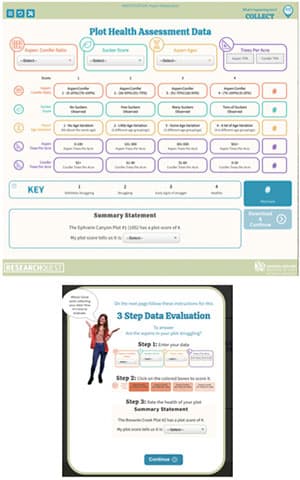 |
Once all of your data has been collected you will evaluate the health of your plot. Enter your data into the fields near the top of the screen. Then, score your plot by clicking on the corresponding buttons on the Plot Health Assessment Data rubric. Hint: Refer to your Data Tracker. Then, rate the health of your plot. |
Students will use their data to fill out the Plot Health Assessment Data rubric. Referencing the data they collected they will score their data by clicking the corresponding colored buttons in the rubric. This will automatically calculate the health score of their plot. Students will download this data and use it to develop their responses in the final reflection for Part 2 of this investigation. Note: Students may need to round their scores to the nearest whole number. It is subjective whether they round up or down. |
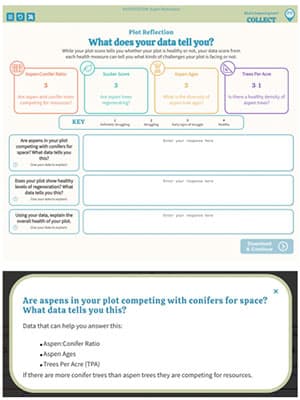 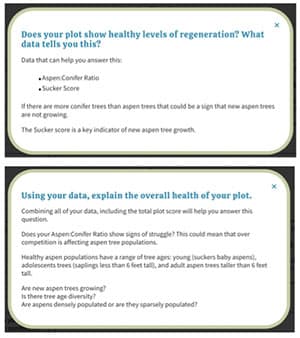 |
In this last activity of Part 2, you’ll now share your findings. Use your data to help you reflect on the health of the aspen populations in your plot. Hint: Use the (?) next to each question to provide support to guide your response. |
Using the data they collected and the health score of their plot students will develop explanations based on evidence that describes the current condition of their plot.
Note: There is no specific response length. You may choose to provide that for your students. However, there is built-in support to help students reflect on the data they collected and analyzed. |
Part 3: CONNECT
What can we do?
OVERVIEW
In Part 3, students use site data (averages of all the plots in their site) and deductive reasoning to determine whether their site needs restoration treatments or not. They will look at specific data points to decide what might be causing the issues, if any, in their site. Students will be introduced to different treatment options for each possible issue found in their site.| STUDENT ACTION | TEACHER ACTION | |
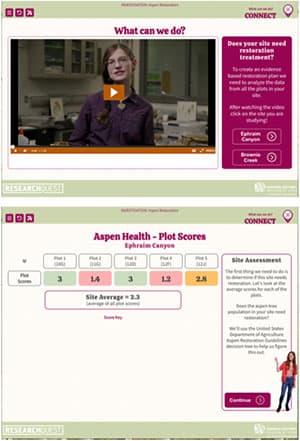 |
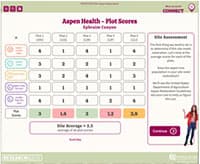
Watch the video that starts this part of the investigation. (1:18 min) Then, select the site of the plot you studied. Each site averages the plot totals. Hint: You can see the details of how these totals were calculated by clicking the down arrow and expanding the chart. |
The video provides an introduction and overview for the decision trees students will create in this part of the investigation. Students are encouraged to select the site of the plot they studied in Part 2 of the investigation. The Site Average chart can be expanded to show the totals from each of the plots in the site. Click the down arrow above “Plot Scores” in the upper left corner.
|
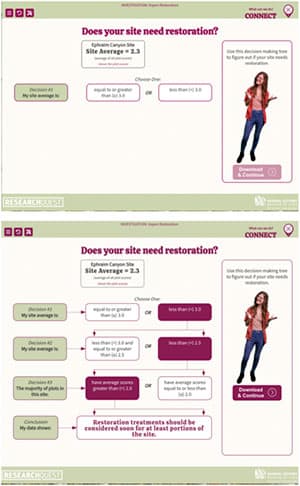 |
Use the decision tree to determine whether your site needs restoration treatment or monitoring. After completing your decision tree you will review the recommendations found in the guidelines. Then, you will develop a conclusion based on the decisions you made. |
Students will determine whether their site needs restoration treatment or monitoring by using the Guidelines for Aspen Restoration decision tree. Note: There are three levels of decisions students will need to make using this decision-making tree. They can use the site average listed at the top of their screen. (See the Site Scores Rubric which you can use as you support your students.) |
 |
Now look at each assessment measure to see what if any restoration treatments are needed or what needs to be monitored in your site. Note: You’ll be using the same guidelines as the professional land managers in the field. |
Once students have determined whether their site needs restoration treatment or monitoring, they will continue using the Guidelines for Aspen Restoration (used by land managers throughout the country), to determine what measures should be taken to support the health of aspen populations in their site. Note: Students will be able to see an expanded view of this chart by clicking the arrow to the left of “Plot Scores. ” |
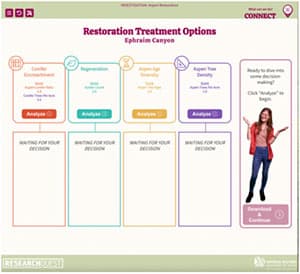 |
Select the health measures to analyze. Collect all four to continue. |
Students are given a list of health measures to analyze for each data point. They will be able to download the results when they have completed their analysis. |
| Conifer Encroachment Are aspen and conifers competing for resources? |
|
|---|---|
Use the site averages of Aspen:Conifer Ratio and the Conifer Tree Density to find out how these health measures impact your site. |
Students will use this mini-decision tree to make two decisions depending on which of these two most prevalent impacts are harming their aspen forest. Depending on their selections they will gather input from the Guidelines for Aspen Restoration to gain a deeper understanding of how conifer encroachment may be impacting their site. |
 |
|
| Regeneration Are aspen trees regenerating? |
|
|---|---|
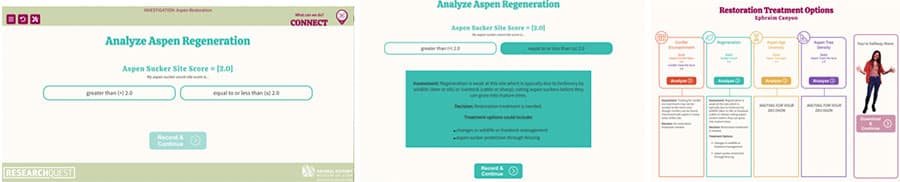
Use the site average of Aspen Sucker Score to find out how these health measures impact your site. |
Students will use this mini-decision tree to make one decision. Use the site average of Aspen Sucker Score to find out how these health measures impact your site. Depending on their selection they will get the results of how regeneration is most likely impacting their site. |
 |
|
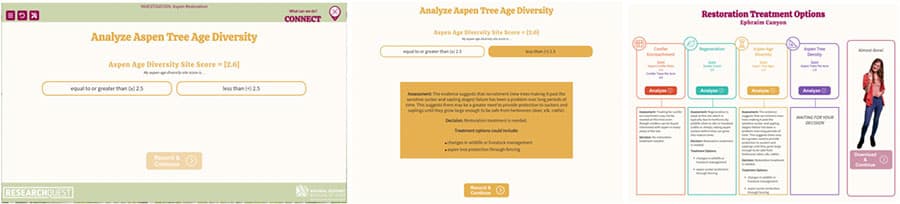
| Aspen Tree Age Diversity What is the diversity of aspen tree ages? |
|
|---|---|
Use the site average of Aspen Age Diversity to find out how this health measure may be impacting your site. |
Students will use this mini-decision tree to make one decision. Depending on their selection they will get the results of how regeneration is most likely impacting their site. |
 |
|
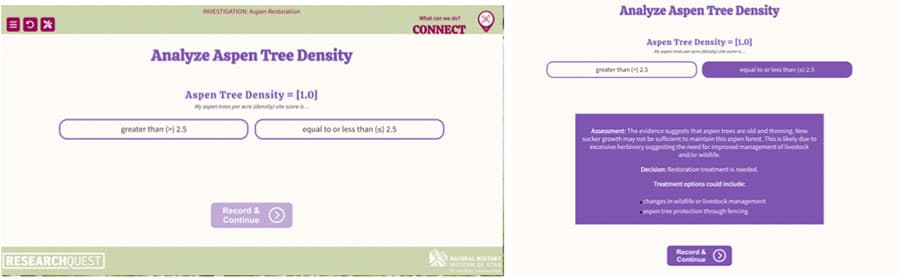
| Aspen Tree Density Is there a healthy density of aspen trees? |
||
|---|---|---|
Use the site average of Aspen Tree Density to find out how this health measure may be impacting your site. |
Students will use this mini-decision tree to make one decision. Depending on their selection they will get the results of how regeneration is most likely impacting their site. |
|
 |
||
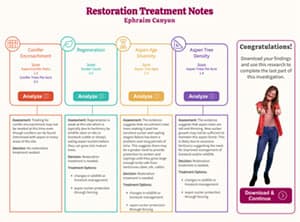 |
Great work! Download your findings and complete the summary statement on the second page of your data tracker. |
Once students have completed all four health measure decision trees they are encouraged to complete a summary statement on the second page of their Data Tracker. |
Part 4: Share
What is your recommendation?
OVERVIEW
In this part, students will need to decide on what restoration treatments or monitoring plan will be the best option for their site. Students with the same site may come up with different conclusions and should all use evidence to support their plan. Authentic science, especially land management has many variables and there is often more than one “correct” answer.
| STUDENT ACTION | TEACHER ACTION | |
 |
Watch the video that starts this part of the investigation. (0:30 sec) |
Students will watch to learn more about how field managers use the data they collected and analyzed to make informed decisions about how best to support aspen populations in their site. |
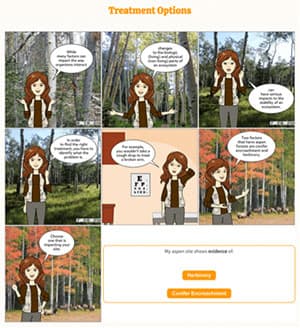 |
Select the factor that is most likely impacting your site, herbivory or conifer encroachment. Hint: You can explore both options if you’d like. |
Students are given a comic to help guide them in thinking about why matching the problem to the solution is important. They will then need to select the factor that is most likely impacting the aspen populations in their site, herbivory or conifer encroachment. |
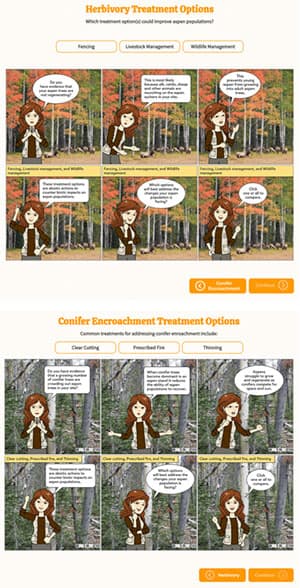 |
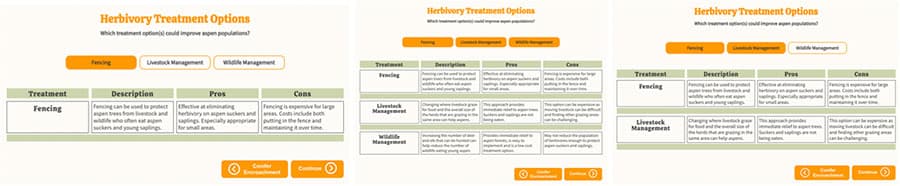
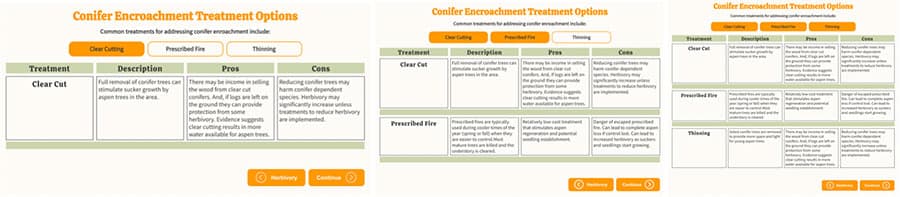
Read through the comic at the beginning of your selected factor, then decide which treatment options you’d like to dive deeper into. Select one or all three to compare. |
Students are given a comic to help introduce them to the factor they selected. They will then need to select one or all three of the treatment/monitoring options, to compare, at the top of the screen. These treatment option charts provide students with a description, pros, and cons of each option. Note: They are also given the option to review the other factor they did not previously select. (See the Treatment Options Chart and Aspen Vocabulary which you can use as you support your students.) |
 |
||
 |
||
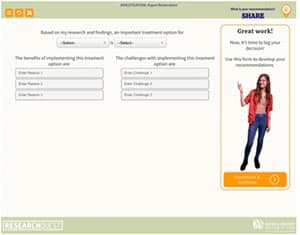 |
Which option will most likely benefit the aspen populations in your site? Log your findings. |
Once students have compared their options, they will select at least one they would recommend. Including the benefits and challenges of this option NOTE: Although there is space for up to 3 reasons, students only need to enter 1 reason to continue. |
 |
Select either the Restoration Plan or Monitoring Plan template to create a presentation to share your findings. |
Students will now compile all of the data and information they collected and analyzed throughout the investigation to create a presentation of their findings. Note: Students can select to create a copy in Google Slides or download a PowerPoint to edit. |
 |
Now it’s time to reflect and celebrate all of the work you’ve done! (2:02 min) |
Encourage students to reflect on the work they’ve done and how different factors can impact populations. Do they see patterns of change in other ecosystems? How might they measure that change and what would they use to inform restoration? |